

Exam Dumps PL-300 Practice Free Latest Microsoft Practice Tests
PL-300 Exam Questions | Real PL-300 Practice Dumps
NEW QUESTION # 130
You have a dataset named Pens that contains the following columns:
* Item
* Unit Price
* Quantity Ordered
You need to create a visualization that shows the relationship between Unit Price and Quantity Ordered. The solution must highlight orders that have a similar unit price and ordered quantity.
Which type of visualization and which feature should you use? To answer, select the appropriate options in the answer area.
NOTE: Each correct selection is worth one point.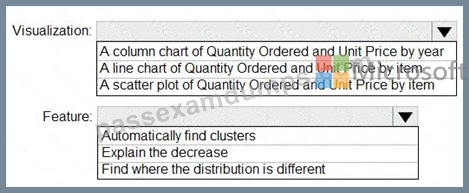
Answer:
Explanation: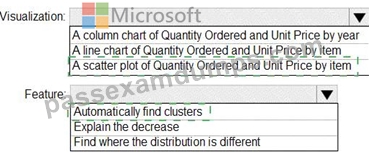
Explanation: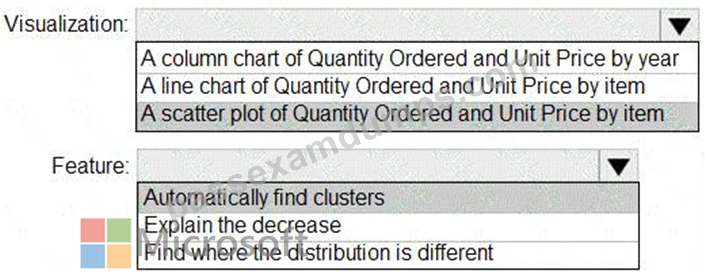
Box 1: A scatter plot...
A scatter chart always has two value axes to show: one set of numerical data along a horizontal axis and another set of numerical values along a vertical axis. The chart displays points at the intersection of an x and y numerical value, combining these values into single data points. Power BI may distribute these data points evenly or unevenly across the horizontal axis. It depends on the data the chart represents.
Box 2: Automatically find clusters
Scatter charts are a great choice to show patterns in large sets of data, for example by showing linear or non-linear trends, clusters, and outliers.
Reference:
https://docs.microsoft.com/en-us/power-bi/visuals/power-bi-visualization-scatter
NEW QUESTION # 131
You create the following step by using Power Query Editor.
= Table.ReplaceValue(SalesLT_Address,"1318","1319",Replacer.ReplaceText,{"AddressLine1"}) A row has a value of 21318 Lasalle Street in the AddressLine1 column. What will the value be when the step is applied?
- A. 21318 Lasalle Street
- B. 0
- C. 1
- D. 21319 Lasalle Street
Answer: D
Explanation:
Example:
Replace the text "ur" with the text "or" in the table.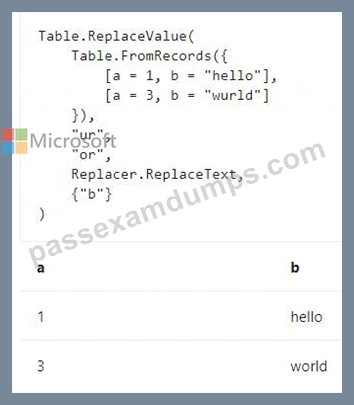
Reference:
https://docs.microsoft.com/en-us/powerquery-m/table-replacevalue
NEW QUESTION # 132
You are creating a Microsoft Power BI data model that has the tables shown in the following table.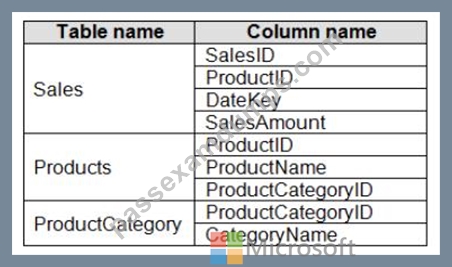
The Products table is related to the ProductCategory table through the ProductCategoryID column.
You need to ensure that you can analyze sales by product category.
How should you configure the relationships from Products to ProductCategory? To answer, select the appropriate options in the answer area.
NOTE: Each correct selection is worth one point.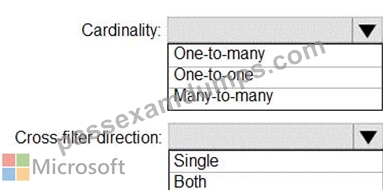
Answer:
Explanation: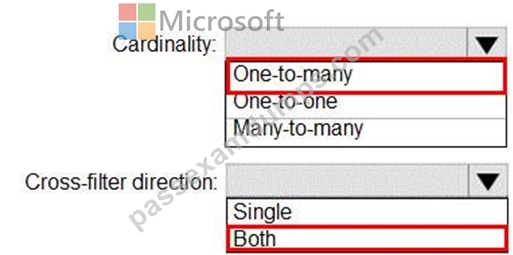
Reference:
https://docs.microsoft.com/en-us/power-bi/transform-model/desktop-relationships-understand
NEW QUESTION # 133
You have a table that contains a column named Phone. The following is a sample of the data in the Phone column.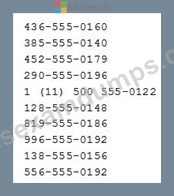
You need to add a new column that contains the data in the format of nnn-nnn-nnnn.
How should you complete the Query Editor formula? To answer, select the appropriate options in the answer area.
NOTE: Each correct selection is worth one point.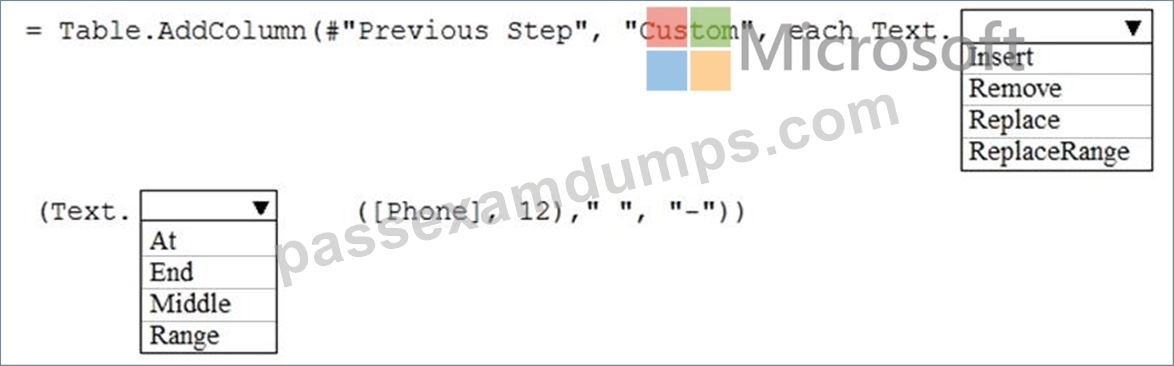
Answer:
Explanation: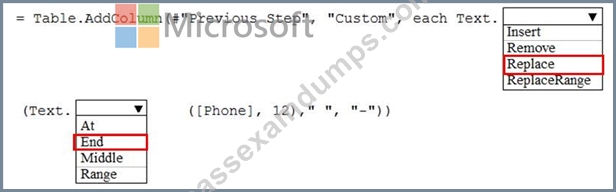
Reference:
https://docs.microsoft.com/en-us/powerquery-m/text-replace
https://docs.microsoft.com/en-us/powerquery-m/text-end
NEW QUESTION # 134
You are creating a report in Power BI Desktop.
You load a data extract that includes a free text field named coll.
You need to analyze the frequency distribution of the string lengths in col1. The solution must not affect the size of the model.
What should you do?
- A. From Power Query Editor, change the distribution for the Column profile to group by length for col1
- B. In the report, add a DAX calculated column that calculates the length of col1
- C. In the report, add a DAX function that calculates the average length of col1
- D. From Power Query Editor, add a column that calculates the length of col1
Answer: A
Explanation:
From Power Query.. highlight the column.. from the tab view select Column Profile Option.. in the Value distribution section that appears below, from the 3dots.. you can change to group by text length distribution
NEW QUESTION # 135
You have a folder of monthly transaction extracts.
You plan to create a report to analyze the transaction data.
You receive the following email message: "Hi. I've put 24 files of monthly transaction data onto the shared drive. File Transactions201901.csv through Transactions201912.csv have the latest set of columns, but files Transactions201801.csv to Transactions201812.csv have an older layout without the extra fields needed for analysis. Each file contains 10 to 50 transactions." You get data from the folder and select Combine & Load. The Combine Files dialog box is shown in the exhibit. (Click the Exhibit tab.)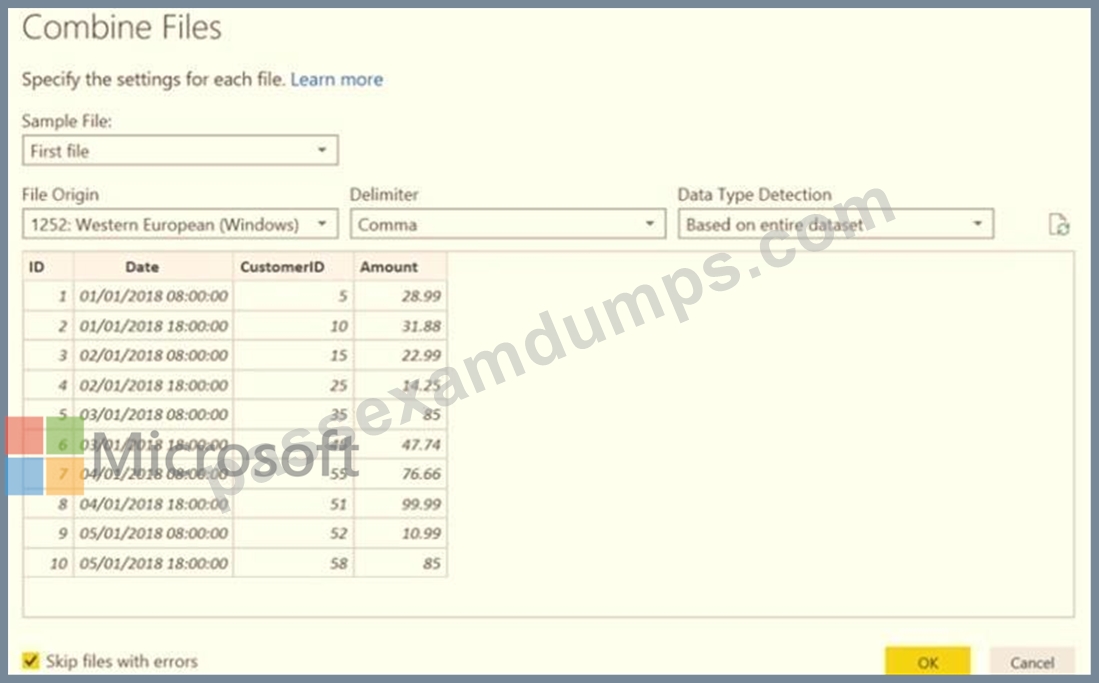
For each of the following statements, select Yes if the statement is true. Otherwise, select No.
NOTE: Each correct selection is worth one point.
Answer:
Explanation:
NEW QUESTION # 136
You create a Power Bl dataset that contains the table shown in the following exhibit.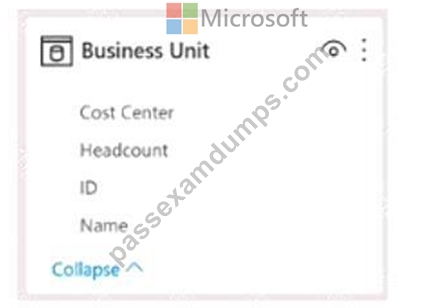
You need to make the table available as an organizational data type In Microsoft Excel.
How should you configure the properties of the table? To answer select the appropriate options in the answer area.
NOTE: Each correct selection is worth one point.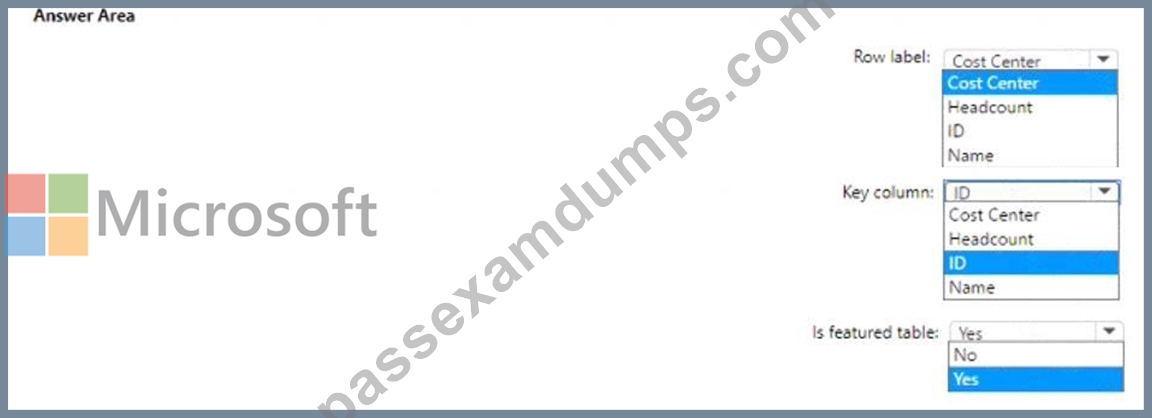
Answer:
Explanation: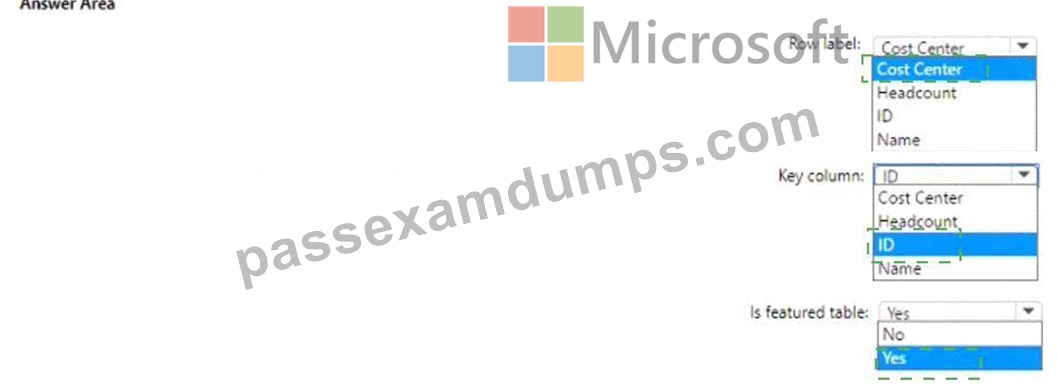
Explanation
NEW QUESTION # 137
You need to address the data concerns before creating the data model. What should you do in Power Query Editor?
- A. Transform the sales_amount column to replace negative values with 0.
- B. Select Column distribution.
- C. Select Column profile, and then select the sales_amount column.
- D. Select the sales_amount column and apply a number filter.
Answer: C
NEW QUESTION # 138
You have a Microsoft Exert spreadsheet named Excel1 that contains survey results.
You have a Power Bl dashboard named DashboardA that has Q&A enabled.
You need to ensure that users who can access DashboardA can ask Questions based on the contents of Excel 1 and pm visuals based on their queries to Dashboard Which three actions should you perform in sequence? To answer, move the appropriate actions from the list of actions to the answer area and arrange them in the correct order.
Answer:
Explanation: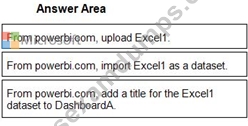
1 - From powerbi.com, upload Excel1.
2 - From powerbi.com, import Excel1 as a dataset.
3 - From powerbi.com, add a title for the Excel1 dataset to DashboardA.
NEW QUESTION # 139
You have a report in Power BI Desktop as shown in the following exhibit.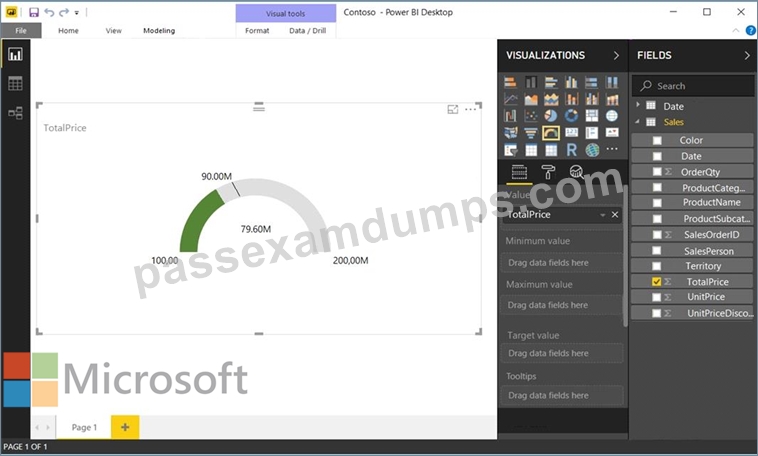
Use the drop-down menus to select the answer choice that completes each statement based on the information presented in the graphic.
Note: Each correct selection is worth one point.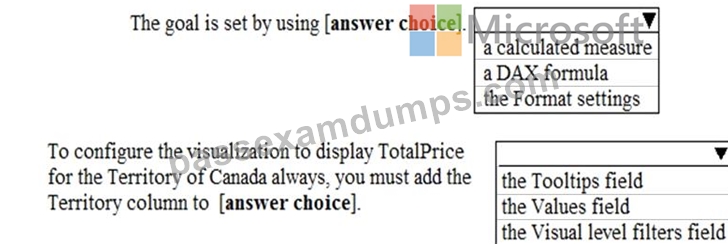
Answer:
Explanation: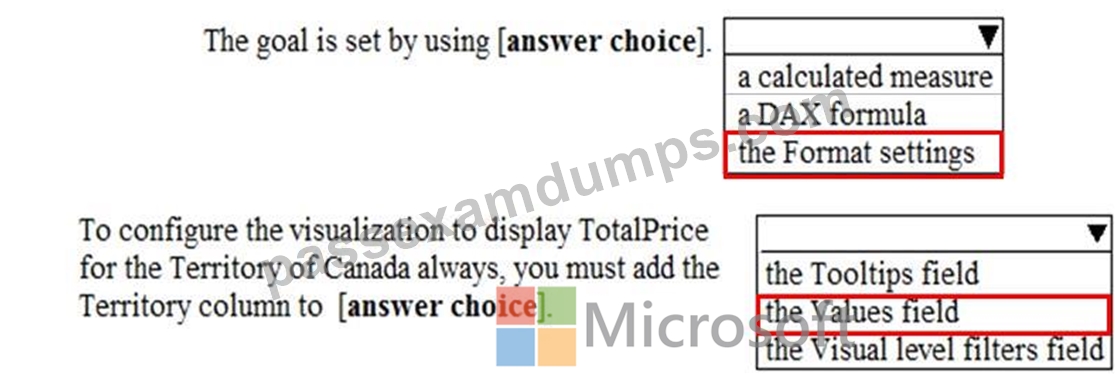
NEW QUESTION # 140
You are modeling data in table named SalesDetail by using Microsoft Power Bl.
You need to provide end users with access to the summary statistics about the SalesDetail data. The users require insights on the completeness of the data and the value distributions.
Which three actions should you perform in sequence? To answer, move the appropriate actions from the list of actions to the answer area and arrange them in the correct order.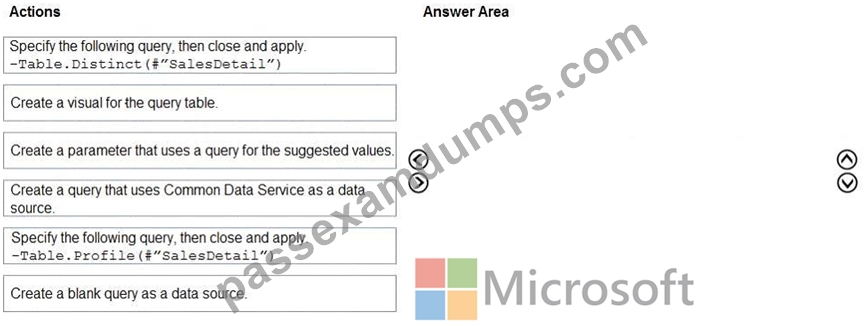
Answer:
Explanation: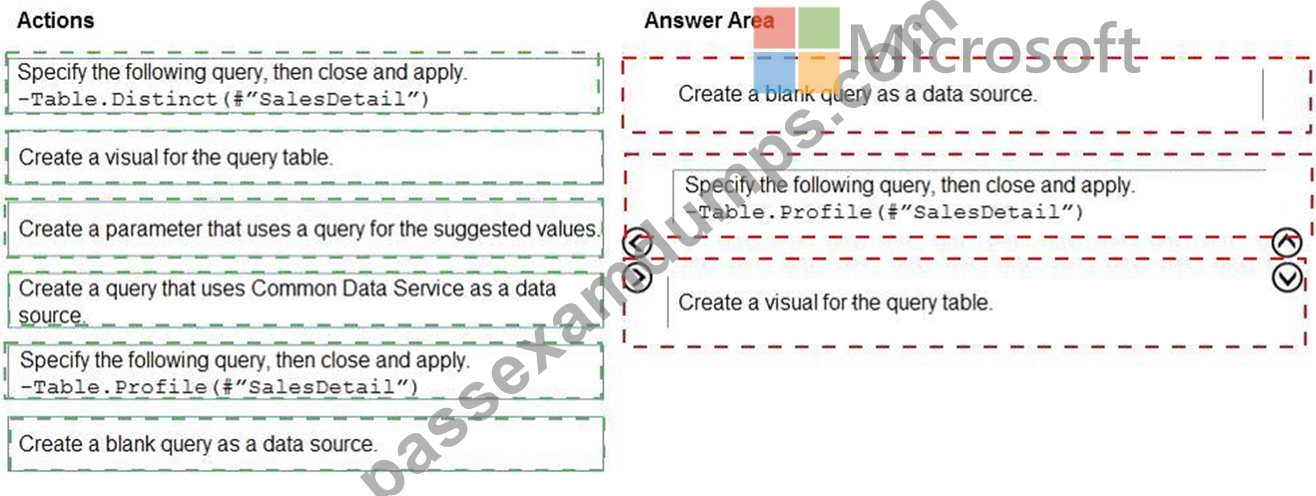
Explanation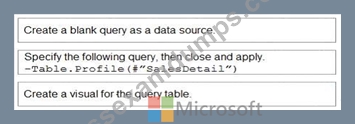
NEW QUESTION # 141
You are creating a quick measure as shown in the following exhibit.
You need to create a monthly rolling average measure for Sales over time-How should you configure the quick measure calculation? To answer, select the appropriate options in the answer area.
NOTE: Each correct selection is worth one point.
Answer:
Explanation:
Reference:
https://docs.microsoft.com/en-us/power-bi/transform-model/desktop-quick-measures
NEW QUESTION # 142
You have a custom connector that returns ID, From, To, Subject, Body, and Has Attachments for every email sent during the past year. More than 10 million records are returned.
You build a report analyzing the internal networks of employees based on whom they send emails to.
You need to prevent report recipients from reading the analyzed emails. The solution must minimize the model size.
What should you do?
- A. From Model view, set the Subject and Body columns to
- B. Implement row-level security (RLS) so that the report recipients can only see results based on the emails they sent.
- C. Remove the Subject and Body columns during the import.
Answer: C
NEW QUESTION # 143
You have a Power BI report that contains a page. The page contains the following visuals:
* A card
* A matrix
* A bar chart
You need to configure the page to ensure that the card and the bar chart are unaffected when a user drills down in the matrix The card and the bar chart must change when a user selects a cell in the matrix.
What should you configure? To answer, select the appropriate options in the answer area.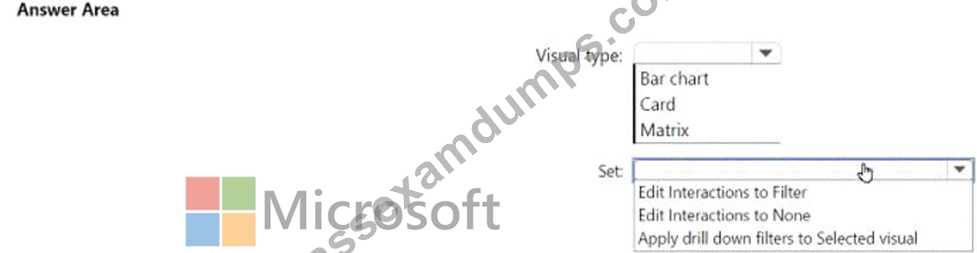
Answer:
Explanation: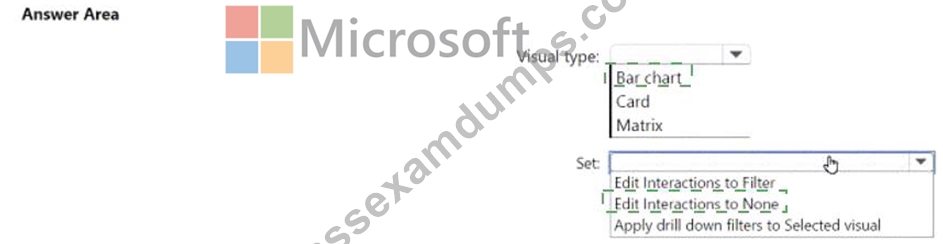
Explanation:
NEW QUESTION # 144
You are modeling data in table named SalesDetail by using Microsoft Power Bl.
You need to provide end users with access to the summary statistics about the SalesDetail dat a. The users require insights on the completeness of the data and the value distributions.
Which three actions should you perform in sequence? To answer, move the appropriate actions from the list of actions to the answer area and arrange them in the correct order.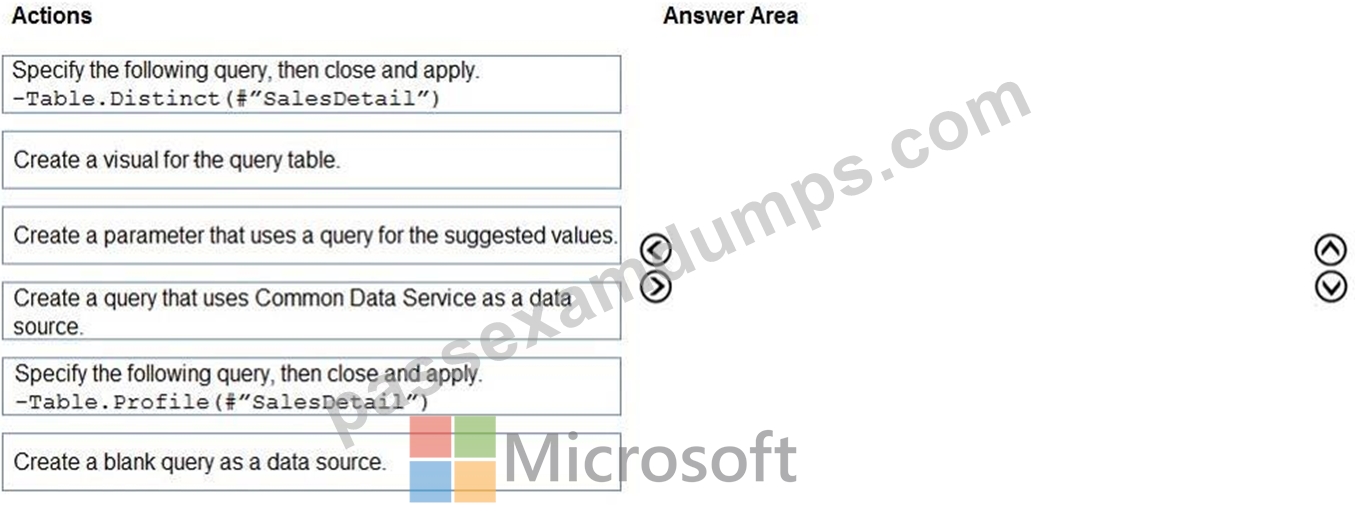
Answer:
Explanation: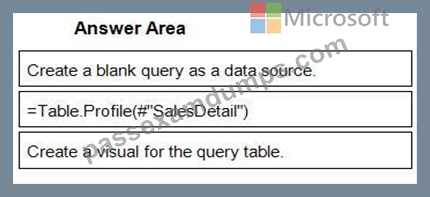
1 - Create a blank query as a data source.
2 - =Table.Profile(#"SalesDetail")
3 - Create a visual for the query table.
NEW QUESTION # 145
Note: This question is part of a series of questions that use the same scenario. For your convenience, the scenario is repeated in each question. Each question presents a different goal and answer choices, but the text of the scenario is the same in each question in this series.
You have a Microsoft SQL Server database that contains the following tables.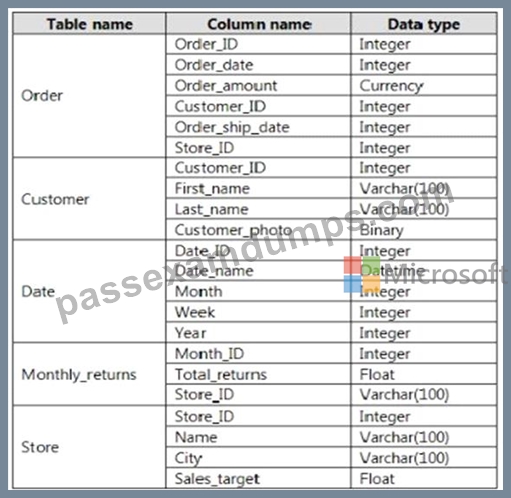
The following columns contain date information:
- Date[Month] in the mmyyyy format
- Date[Date_ID] in the ddmmyyyy format
- Date[Date_name] in the mm/dd/yyyy format
- Monthly_returns[Month_ID] in the mmyyyy format
The Order table contains more than one million rows.
The Store table has a relationship to the Monthly_returns table on the Store_ID column. This is the only relationship between the tables.
You plan to use Power BI Desktop to create an analytics solution for the data.
You need to create a relationship between the Order table and the Store table on the Store_ID column.
What should you do before you create the relationship?
- A. In the Order table query, use the Table.TrasformColumnTypes function.
- B. In the Store table query, use the Table.TrasformRows function.
- C. In the Store table query, use the Table.TrasformColumnTypes function.
- D. In the Order table query, use the Table.TrasformRows function.
Answer: C
NEW QUESTION # 146
You plan to use Power BI to create a quarterly profit report that meets the following requirements:
* Emphasizes the percentage of total profits contributed by each product category in dollars and as a percentage
* Compares profit margins across sales regions
Which type of visual should you use for each requirement? To answer, drag the appropriate visuals to the correct requirements. Each visual may be used once, more than once, or not at all. You may need to drag the split bar between panes or scroll to view content.
NOTE: Each correct selection is worth one point.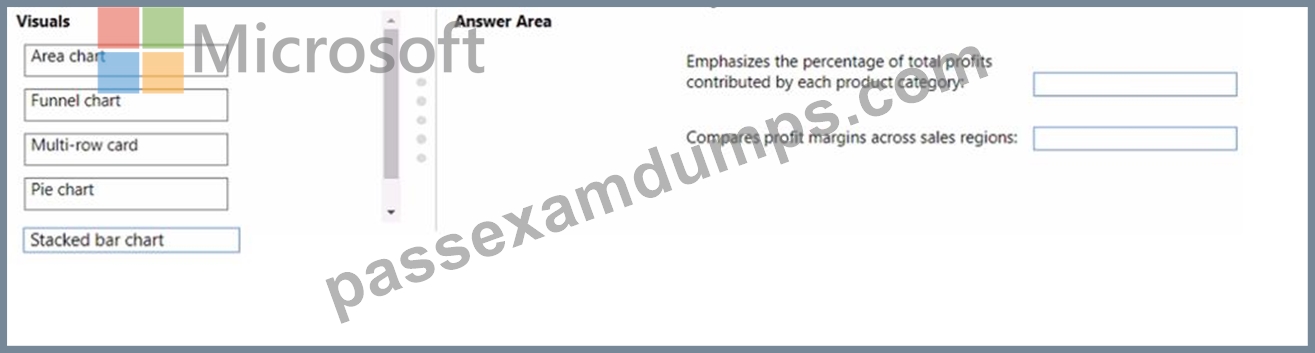
Answer:
Explanation: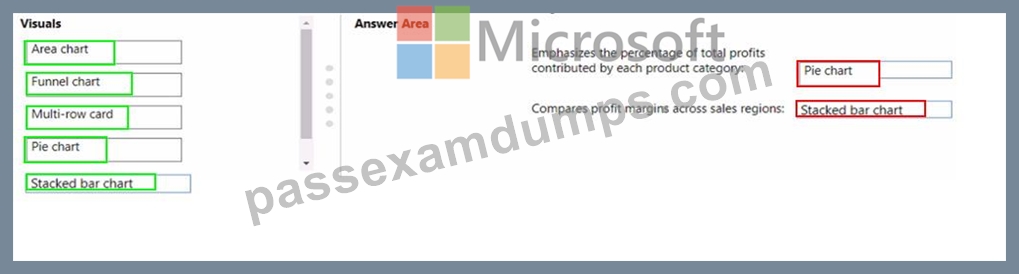
NEW QUESTION # 147
You have a Power BI tenant.
You have reports that use financial datasets and are exported as PDF files.
You need to ensure that the reports are encrypted.
What should you implement?
- A. Microsoft Intune policies
- B. sensitivity labels
- C. dataset certifications
- D. row-level security (RLS)
Answer: B
Explanation:
General availability of sensitivity labels in Power BI.
Microsoft Information Protection sensitivity labels provide a simple way for your users to classify critical content in Power BI without compromising productivity or the ability to collaborate. Sensitivity labels can be applied on datasets, reports, dashboards, and dataflows. When data is exported from Power BI to Excel, PowerPoint or PDF files, Power BI automatically applies a sensitivity label on the exported file and protects it according to the label's file encryption settings. This way your sensitive data remains protected no matter where it is.
Reference:
https://powerbi.microsoft.com/en-us/blog/announcing-power-bi-data-protection-ga-and-introducing-new-capabil
NEW QUESTION # 148
You plan to create the Power Bl model shown in the exhibit. (Click the Exhibit tab.) The data has the following refresh requirements:
* Customer must be refreshed daily.
* Date must be refreshed once every three years.
* Sales must be refreshed in near real time.
* SalesAggregate must be refreshed once per week.
You need to select the storage modes for the tables. The solution must meet the following requirements: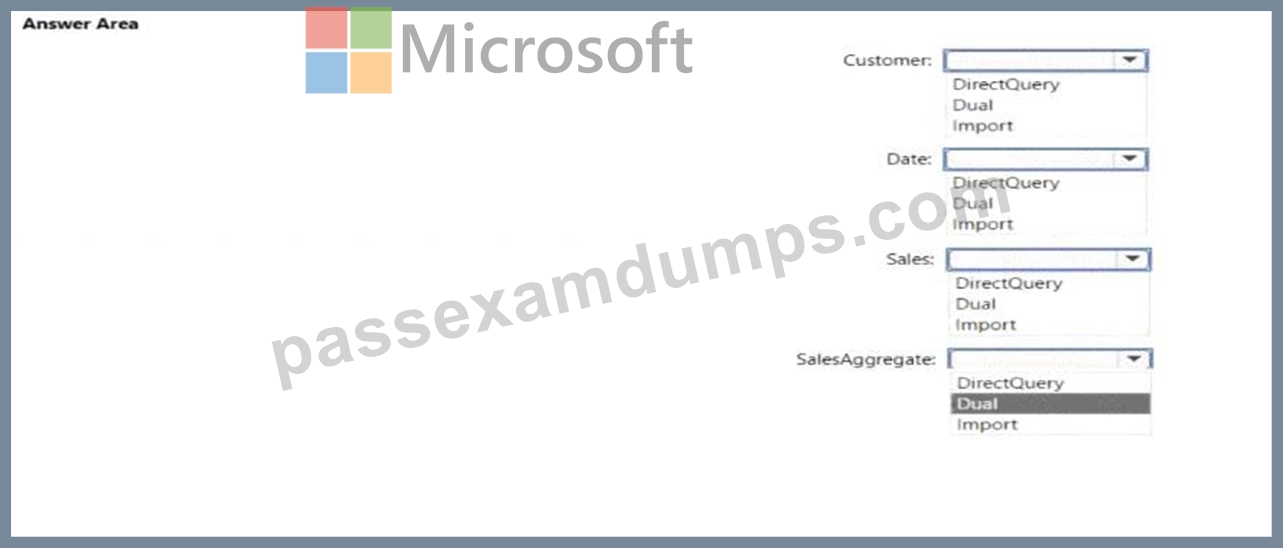
Answer:
Explanation: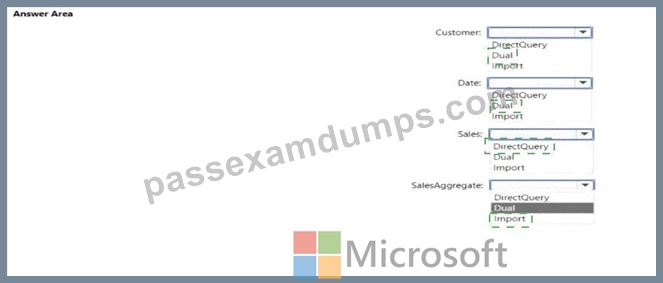
Explanation
NEW QUESTION # 149
You have a Power Bl report that contains a page. The page contains the following:
* A shape named Shape 1
* A card named Sales Summary
* A clustered bar chart named Sales by Region
You need to ensure that Sales Summary renders on top of Shape 1. What should you modify?
- A. Vertical alignment in the Canvas settings
- B. Layer order in the Selection pane
- C. Maintain layer order in the General visual settings
- D. Tab order in the Selection pane
Answer: B
Explanation:
Explanation
You use Power Query Editor to preview the data shown in the following exhibit.
You confirm that the data will always start on row 3, and row 3 will always contain the column names.
You use Power Query Editor to preview the data shown in the following exhibit.
A screenshot of a computer Description automatically generated with medium confidence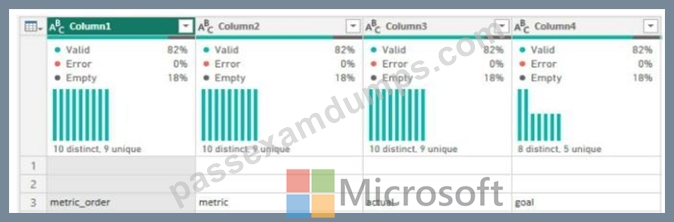
NEW QUESTION # 150
You have a Power B1 report that contains the visuals shown in the following table.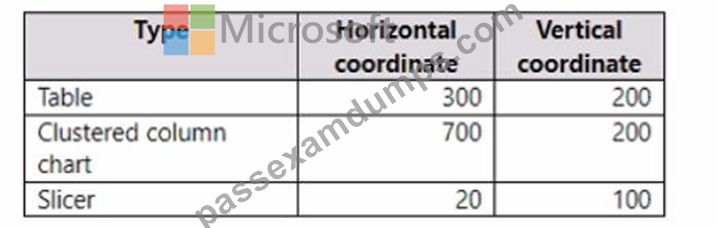
You need to modify the location of each visual.
What should you modify for each visual?
- A. the tab order
- B. the position
- C. the padding
- D. the layer order
Answer: B
NEW QUESTION # 151
You have a CSV file that contains user complaints. The file contains a column named Logged. Logged contains the date and time each compliant occurred. The data in Logged is in the fol-lowing format:
2018-12-31 at 08:59. You need to be able to analyze the complaints by the logged date and use a built-in date hierarchy. What should you do?
- A. Create a column by example that starts with 2018-12-31.
- B. Apply a transformation to extract the last 11 characters of the Logged column and set the data type of the new column to Date.
- C. Apply a transformation to extract the first 11 characters of the Logged column.
- D. split the Logged column by using at as the delimiter.
Answer: C
Explanation:
Explanation
According to Microsoft Certified: Power BI Data Analyst Associate , Power Query Editor is a tool that lets you connect to one or many data sources, shape and transform the data to meet your needs, then load that model into Power BI Desktop2.
One of the transformations you can perform in Power Query Editor is extract date from text, which creates a date value from a textual representation . For example, given a text column like this:
Logged
2018-12-31 at 08:59
2019-01-01 at 09:15
You can extract the date part by using the Date.FromText function with a specific format4. The result will be:
Logged
Date
2018-12-31 at 08:59
2018-12-31
2019-01-01 at 09:15
2019-01-01
This makes it possible to use a built-in date hierarchy for analysis.
NEW QUESTION # 152
You have a report in Power BI Desktop as shown in the following exhibit.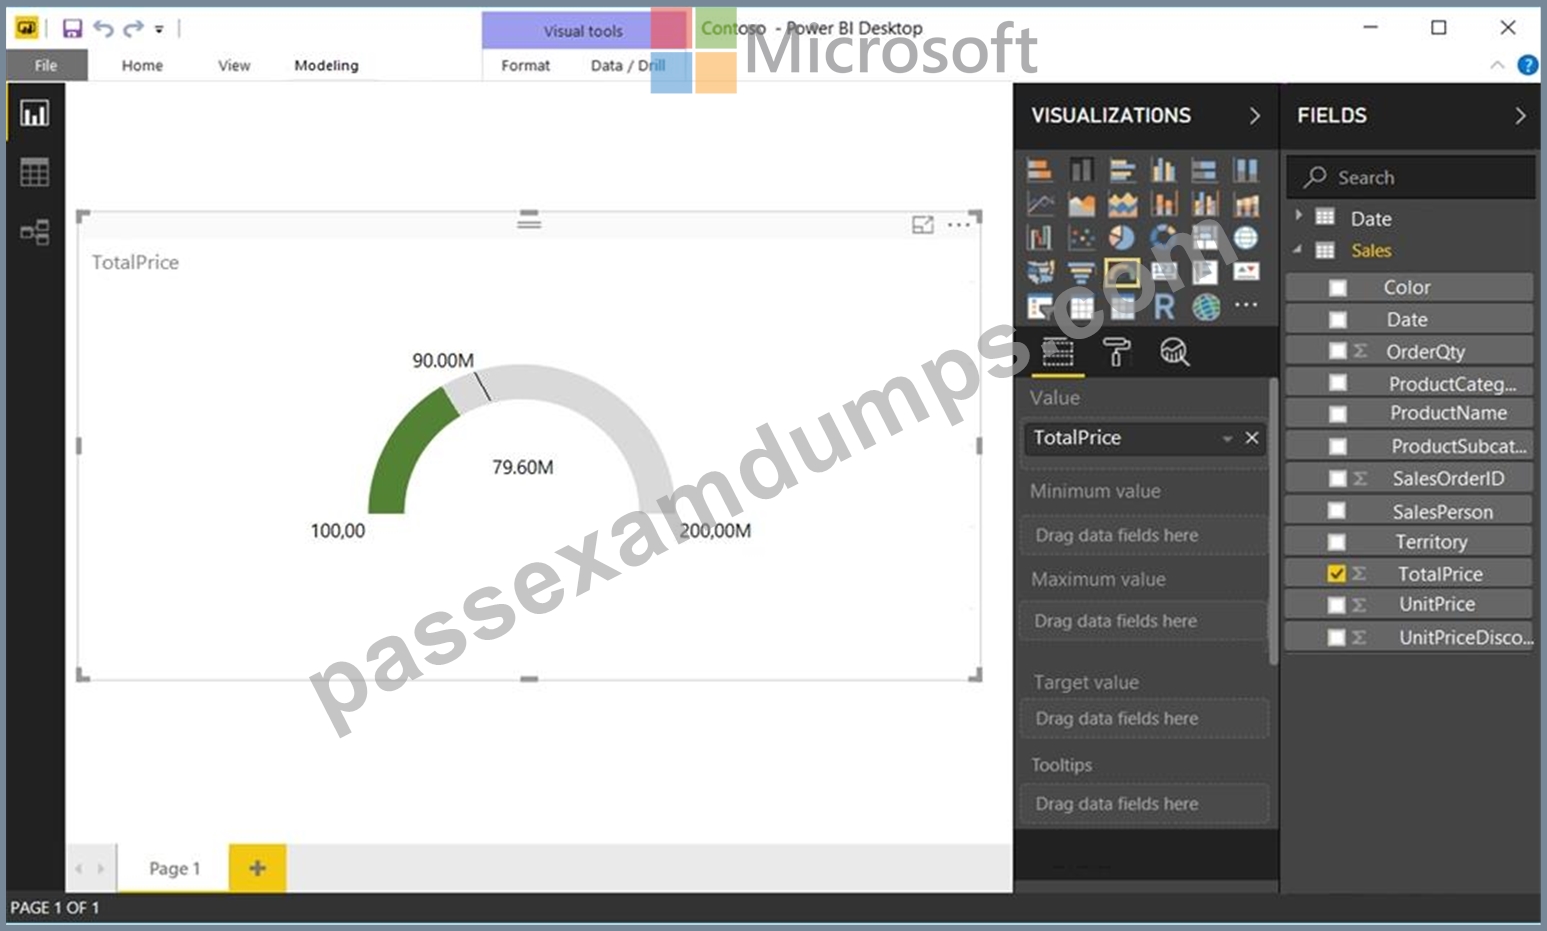
Use the drop-down menus to select the answer choice that completes each statement based on the information presented in the graphic.
Note: Each correct selection is worth one point.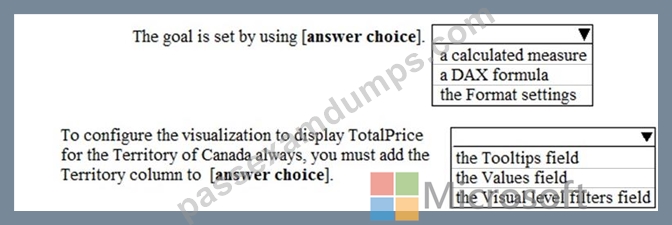
Answer:
Explanation: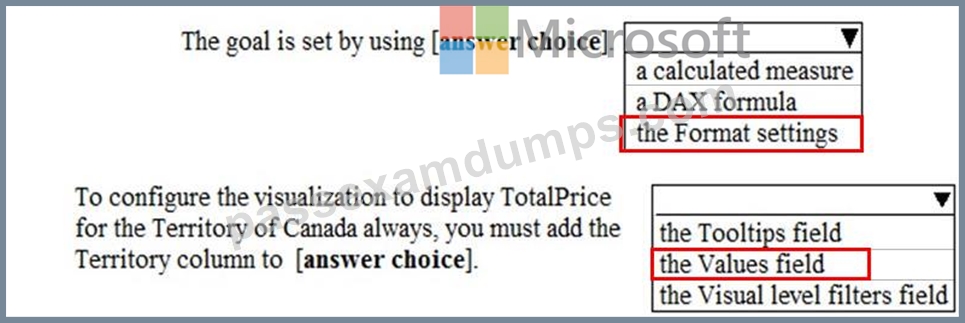
NEW QUESTION # 153
You are building a Power Bl report that uses data from an Azure SQL database named erp1.
You Import the following tables.
You need to perform the following analyses:
* Orders sold over time that include a measure of the total order value
* Orders by attributes of products sold
The solution must minimize update times when interacting with visuals in the report. What should you do first?
- A. Create a calculated column that adds a list of product categories to the Orders table by using a DAX function.
- B. From Power Query, merge the Order Line Items query and the Products query.
- C. From Power Query, merge the Orders query and the Order Line Hems query.
- D. Calculate the count of orders per product by using a DAX function.
Answer: B
Explanation:
https://www.sqlbi.com/articles/header-detail-vs-star-schema-models-in-tabular-and-power-bi/
NEW QUESTION # 154
You need to create a Power BI report. The first page of the report must contain the following two views:
*Sales By Postal Code
*Sales by Month
Both views must display a slicer to select a value for a field named Chain.
The Sales By Postal Code view must display a map visual as shown in the following exhibit.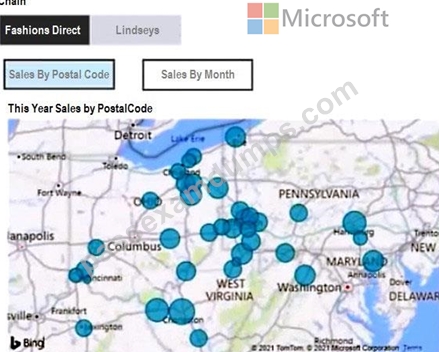
The Sales By Month view must display a column chart visual as shown in the following exhibit.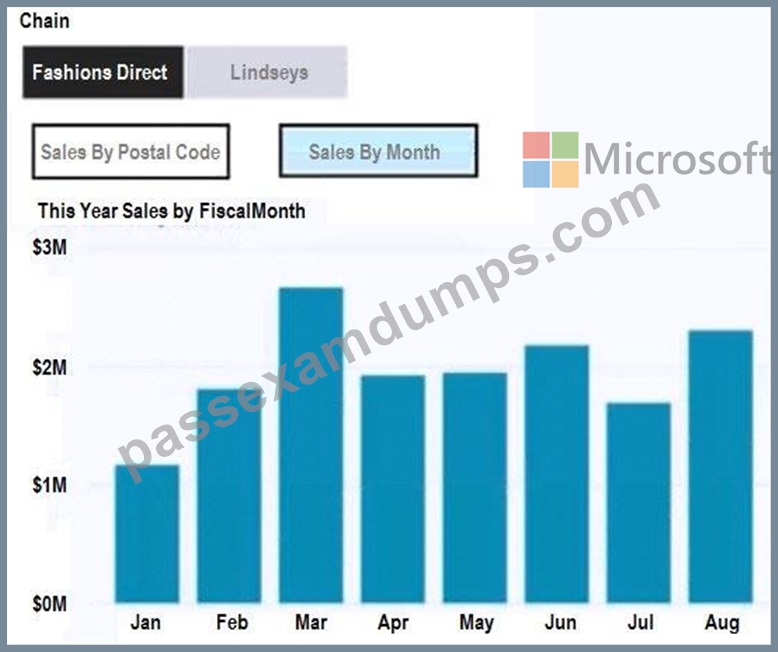
Users must be able to switch between the views by using buttons on the report page. The selected Chain field must be maintained when switching between views.
What is the minimum number of bookmarks required, and which property should you apply to each bookmark? To answer, select the appropriate options in the answer area.
NOTE: Each correct selection is worth one point.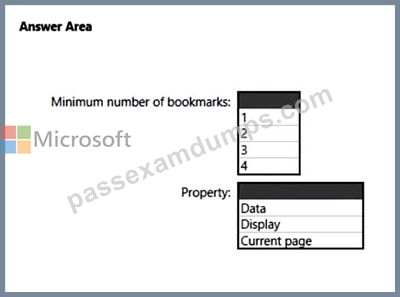
Answer:
Explanation: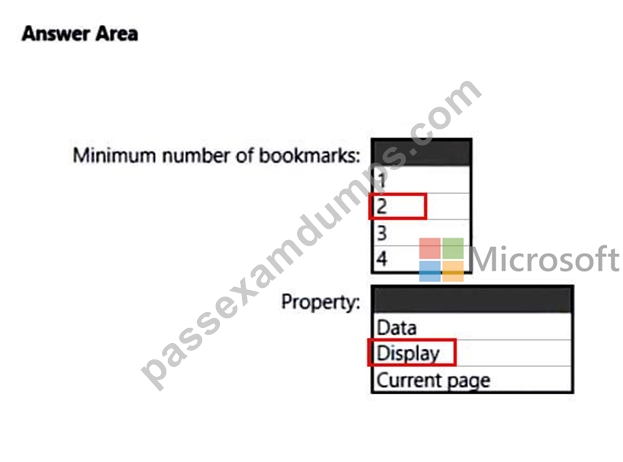
NEW QUESTION # 155
......
Verified PL-300 Exam Dumps Q&As - Provide PL-300 with Correct Answers: https://www.passexamdumps.com/PL-300-valid-exam-dumps.html
Pass Your PL-300 Dumps Free Latest Microsoft Practice Tests: https://drive.google.com/open?id=1GjdpT7qzAV7bi2Webnbsp5op94RG1NFm
